Stocks
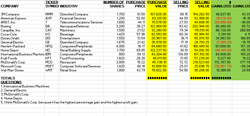
1. In this assignment I created a spreadsheet showing data about different stocks.
2. In this assignment I used Microsoft Excel to create the spreadsheet.
3. By creating this assignment, I learned how to shade a column with color. I also reinforced my prior knowledge of how to use the Auto Fill feature.
4. While completeing this assignment, I did a good job of formating the cells for percentages.
5. Next time I would type out all the data before putting the font, bold, and colors in each cell.
Excel 22
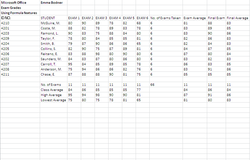
1. In this assignment I created a chart with student's exam grades. Then I entered formulas to organize the data better.
2. The technology skills I needed to complete this assignment were knowing how to enter formulas for the average, highest average, and the lowest average.
3. By creating this assignment I learned how to find the highest and lowest averages for a set of numbers in excel.
4. While completing this assignment, I did a good job of entering the formulas and using the autofill feature to make they job easier.
5. Next time I would add the photo that was included in the example because I forgot to do that.
IPhone Games
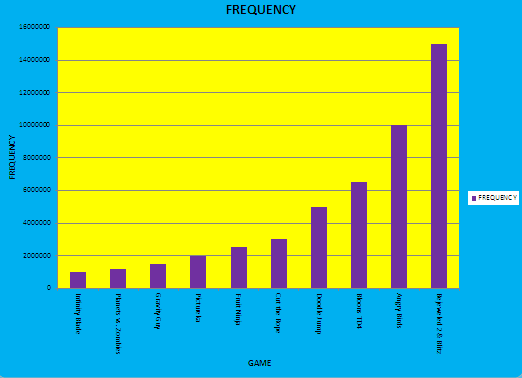
1. In this assignment, I created a column chart containing data about the most popular iPhone games downloaded.
2. The technology skills I needed to create this assignment were being able to create a chart, fill it in with colors, and move the chart to another sheet.
3. By creating this assignment, I learned how to change the background colors of the Chart and Plot Areas.
4. While completeting this assignment, I did a good job of managing my time wisely and staying on task to complete the assignhment within the time alotted.
5. Next time I would type out all the information before I changed the size of the coloumns so that I wouldn't get confused.
Bar Graph Group Project
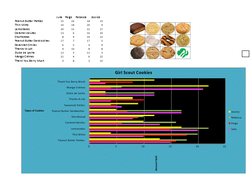
1. In this assignment, we made an example bar graph with information and created a power point presentation. Then we presented that in front of our class and taught them how to make a bar graph.
2. The technology skills I needed to do this was how to insert information into microsoft excel and use that info to make a bar graph. Then I needed to know how to make a power point, which we used to teach the class.
3. While creating this assignment I learned how to change the colors and designs of a bar graph. I also learned how to work well with outhers and make sure everyones ideas and opinions were used the the project.
4. While completing this assignment, I did a good job of listening to the other members of my group and heloing them understand how to make the bar graph well.
5. Next time I would speak louder and make more eye contact in my presentation.

Excel 50: Yacht Mortgage
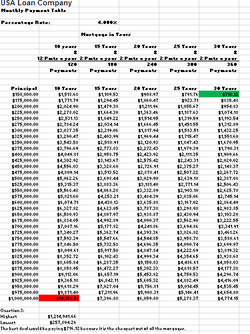
1. In this assignment I created a spreadsheet and filled in the information about a mortage on a yacht. I had to type in the equations to calculate the mortgage for 10 years, 15, 20, 25, and 30 years. Then I used the autofill feature to complete the rest of the sheet.
2. The technology skills I needed to complete this assignment were being able to use Microsoft Excel effectively to complete the spreadsheet with the correct formulas and data.
3. While creating this assignment I learned how to hilight individual cells with different colors such as red and green. I also learned how to use the ($) sign in a formula.
4. While completeing this assignment I did a good job of formating the cells in the chart to make sure they show a ($) sign and two decimals.
5. Next time I would take my time more so I don't make any errors that I have to go back and fix later.
